Market Recap – Week Ending Jan. 26
Encouraging Data Pushes Stocks Higher; Key Earnings This Week
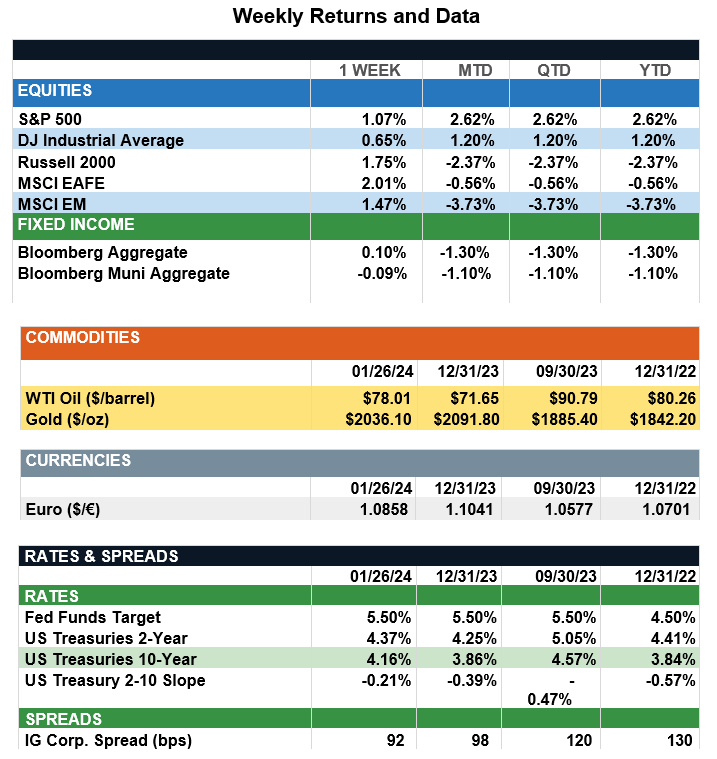
Overview: Stocks across the globe rose last week, led by international developed (MSCI EAFE) up 2.0%, and emerging markets (MSCI EM) up 1.5%. In the U.S., the S&P 500 index was higher by 1.1%, aided by strong economic growth and encouraging inflation data. Real gross domestic product (GDP) rose 3.3% on an annualized basis in the fourth quarter of 2023, well above consensus expectations of 2.0%. The data implies a 3.1% year-over-year increase in GDP for 2023, much higher than the 2.6% the Fed was projecting at their last meeting in December. On the inflation front, the preferred measure of inflation for the Fed, core PCE, fell from 3.2% to 2.9% year-over-year, the lowest level for the indicator since March 2021. Further economic data will come on Friday this week with the unemployment report, where nonfarm payrolls are expected to increase by 170,000, indicating an ongoing tight labor market. With the Federal Reserve meeting concluding on Wednesday of this week, investors will look for further clues from the Fed as to the ongoing course of monetary policy. Markets currently are pricing in about a 50/50 chance of a rate cut at the March meeting of the Fed, with futures markets expecting 5-6 rate cuts by the end of 2024. Other important market news this week will come in the form of earnings. This week is the busiest of the fourth-quarter earnings season with 109 of the 500 S&P 500 companies scheduled to report earnings. Five of the so-called “magnificent 7” companies – Microsoft, Apple, Facebook, Google, and Amazon – will report, which will have a huge impact on earnings and forward guidance as investors evaluate valuations in the markets.
Update on Valuations (from JP Morgan): After a two-year stretch marked with significant uncertainty, the S&P 500 overcame the “wall of worry” about a potential hard landing for the U.S. economy, achieving a new all-time high on Jan. 19 and notching successive highs for five consecutive days last week. While the time to recovery was the third-longest since 1988, it was notable for its resilience on the back of strong fundamentals, despite pressures from multi-decade high interest rates. However, it also has resulted in elevated valuations, leaving some investors, especially those who waited in cash on the sidelines, wondering where markets could go from here. For investors wary of potential corrections, market highs can lead to a psychological stalemate. However, historical data suggest all-time highs are more common and less daunting than perceived. Since 1988, the S&P 500 has, on average, reached new highs 20 times per year. More importantly, nearly 85% of the time, one-year forward returns from these highs were positive. In fact, during this period one, two and three-year forward returns were more favorable when investing at all-time highs compared to a random day. This compelling outcome aligns with a key market adage: strength begets strength, which in market terms, often translates to the formation of successive highs. Given that markets spend about half the time within 5% of all-time highs, remaining on the sidelines can result in significant opportunity cost. Since fundamentals drive the market over the long run, the recent persistence of strong earnings growth this cycle could further bolster the market. For investors, embracing active management to protect against volatility while understanding momentum can carry markets past all-time highs will be crucial in generating returns this year.
Sources: JP Morgan Asset Management, Goldman Sachs Asset Management, Barron’s, Bloomberg, CNBC
This communication is for informational purposes only. It is not intended as investment advice or an offer or solicitation for the purchase or sale of any financial instrument.
Indices are unmanaged, represent past performance, do not incur fees or expenses, and cannot be invested into directly. Past performance is no guarantee of future results.